.png)
Here you can view and get a better overview of how the sensor has been communicating.
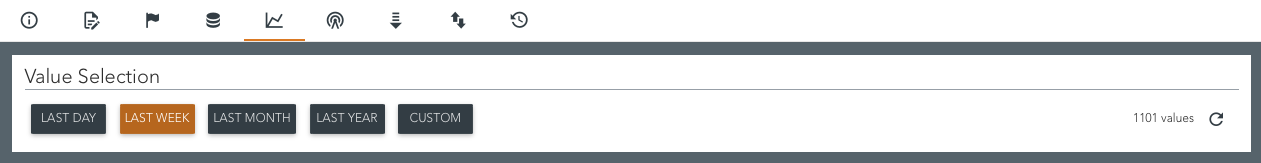
Value Selection
First, you need to select the interval for which you want to fetch values.
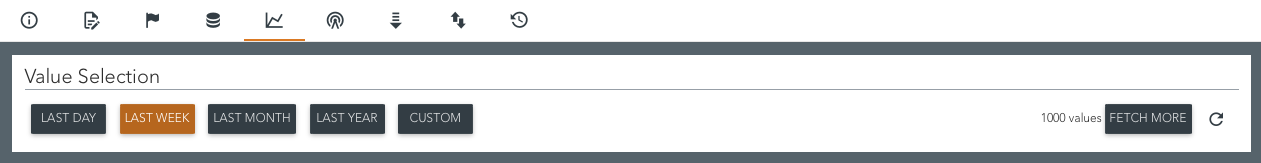
If the result exceeds 1000 messages and you want more values, you need to click on 'FETCH MORE.' This will fetch an additional 1000 values or all the values available within the specified range. You can fetch 1000 values at a time using this method, continuing until you have retrieved the desired number of values.
There is also the possibility to zoom in on the selected interval. To zoom, click and hold the left mouse button in any of the graphs, drag the mouse left or right, and then release the mouse button. This will zoom in on the selected interval in all five graphs. If you want to return to the previous interval, click "Reset zoom."
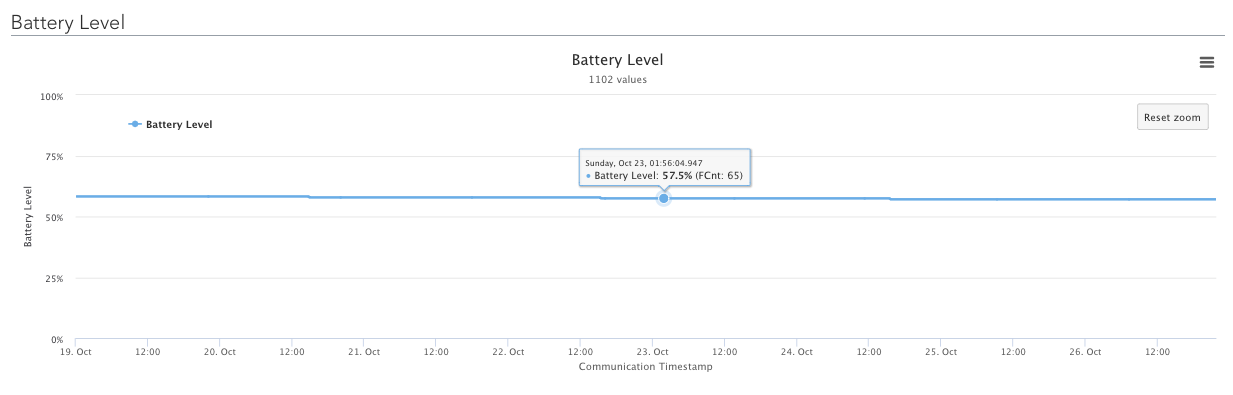
Battery Level
The battery level graph shows the last reported battery level as a percentage.
Spreading Factor
The spreading factor graph shows how the spreading factor changes during the selected interval.
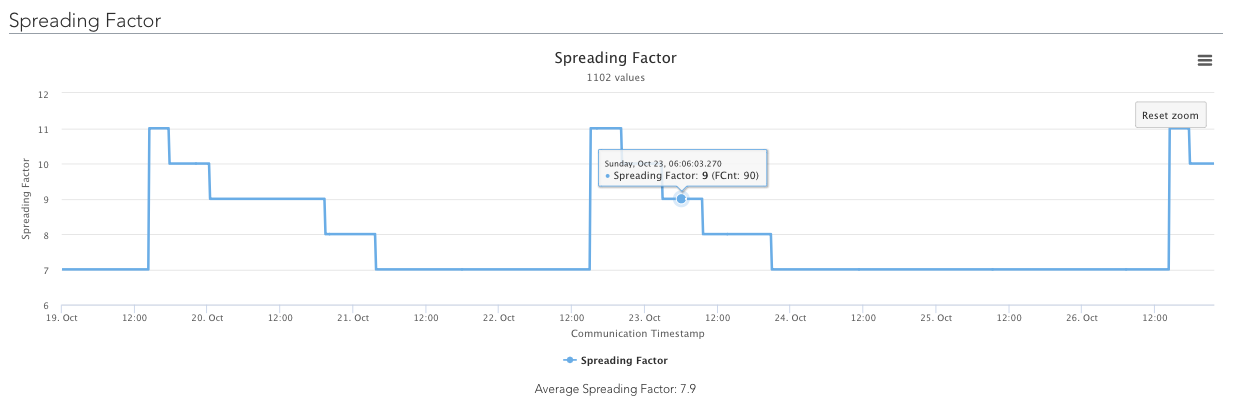
Below the graph, you can view the average Spreading Factor for the selected interval.
Gateway Communication
The gateway communication graph shows all gateways that received messages during the period.
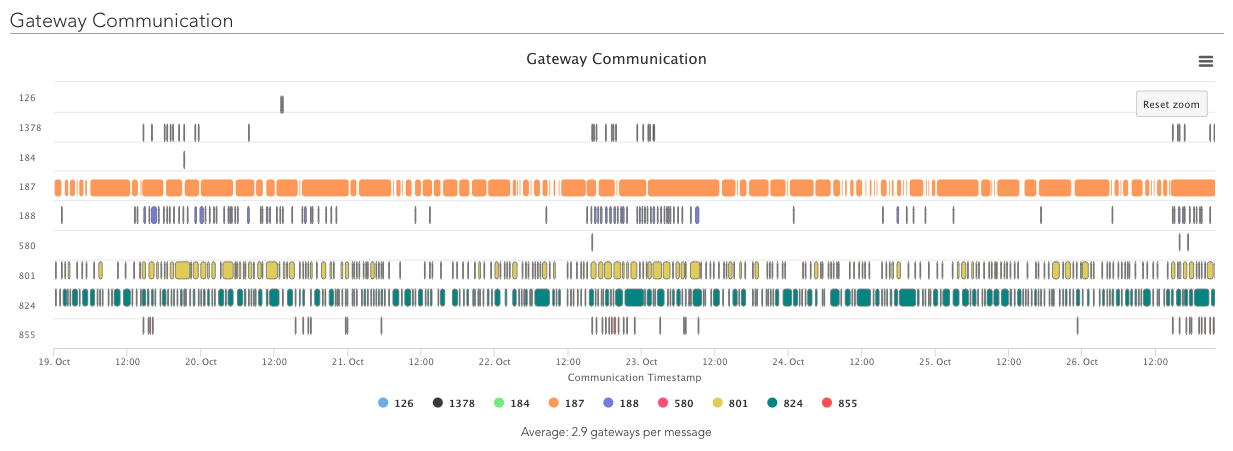
Below the graph, you can view the average number of gateways that receive each message.
Error Rate
The error rate graph displays the error rate, which indicates the percentage of lost packages (messages) during the selected period.
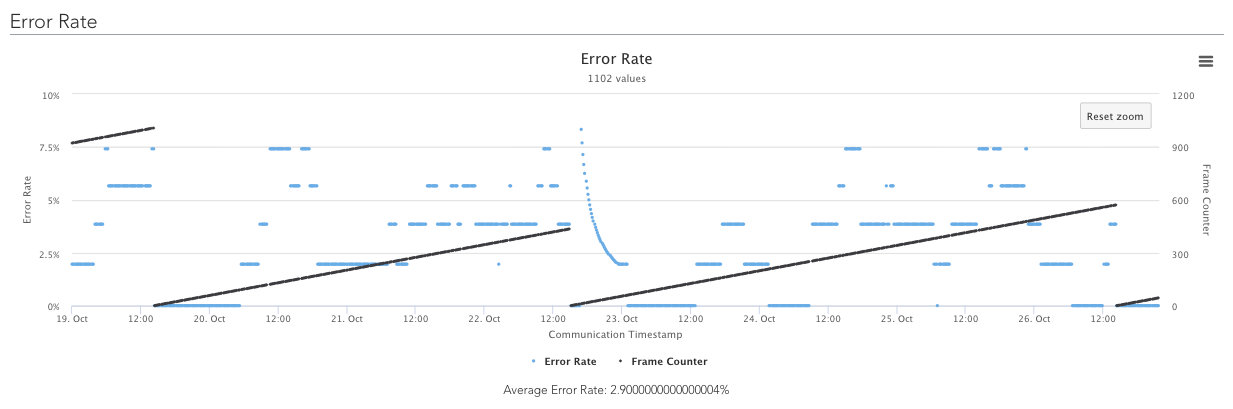
Below the graph, you can view the average error rate.
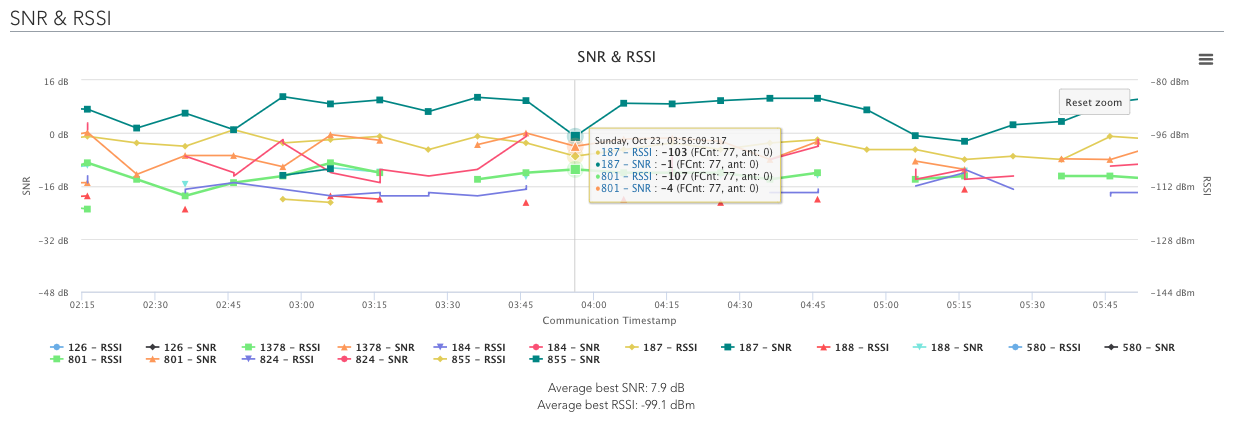
SNR & RSSI
The SNR & RSSI graph shows Signal-to-Noise Ratio and Received Signal Strength Indicator per gateway for every single message.
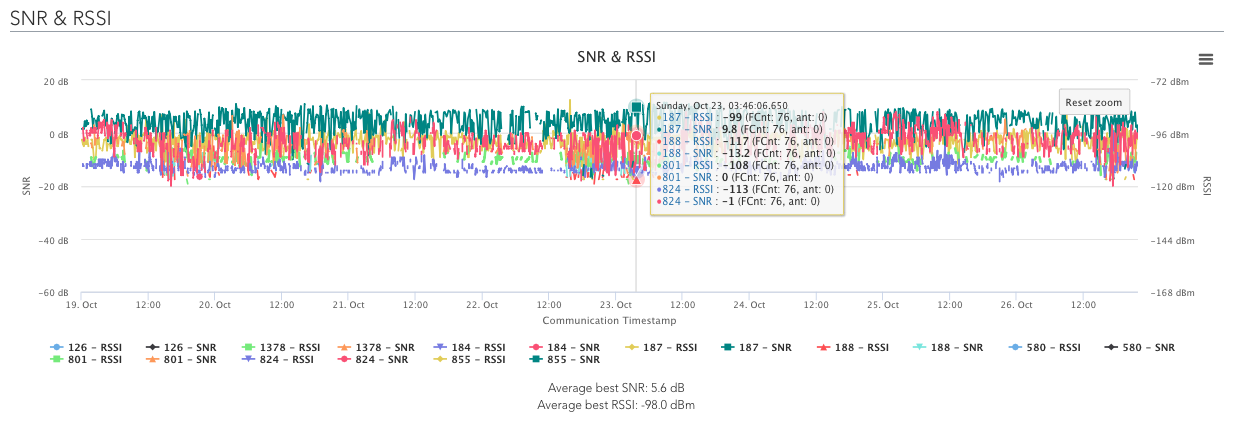
Below the graph, you can view the average best SNR and RSSI per message.