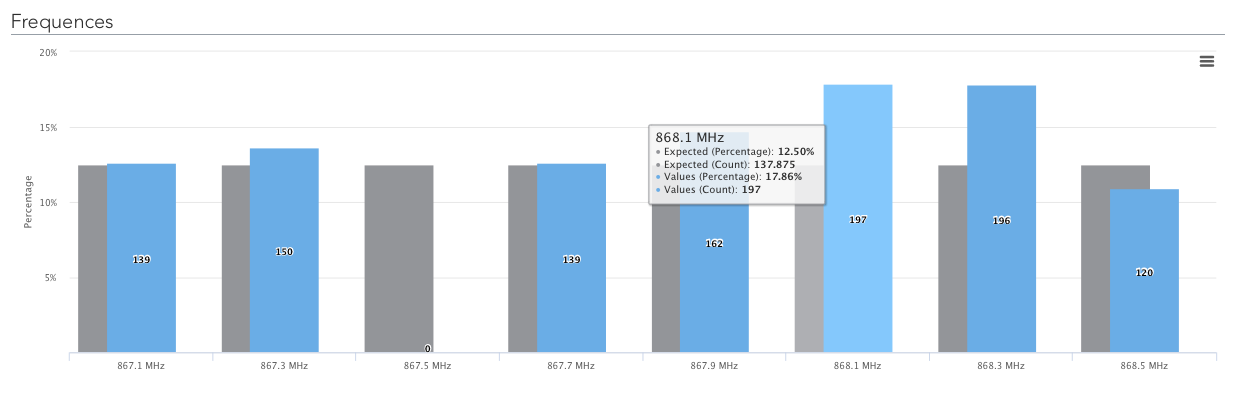
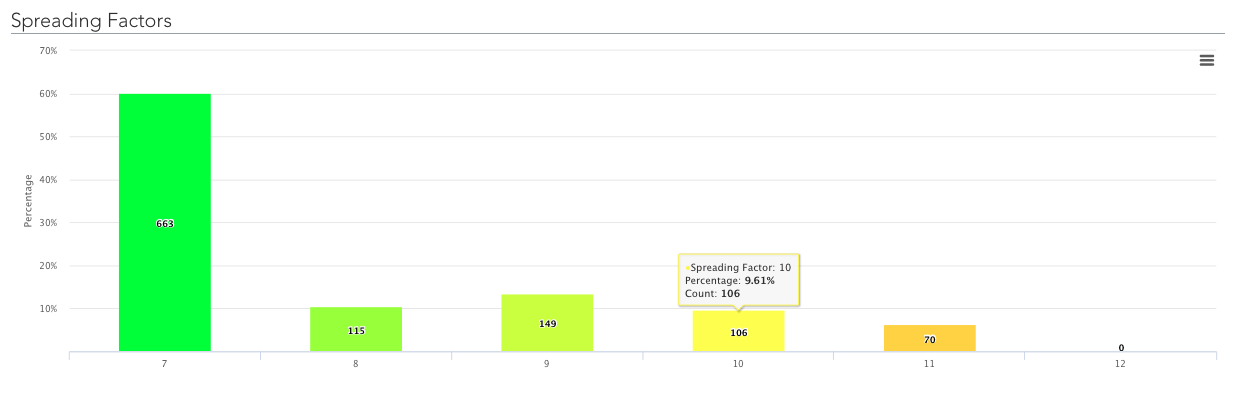
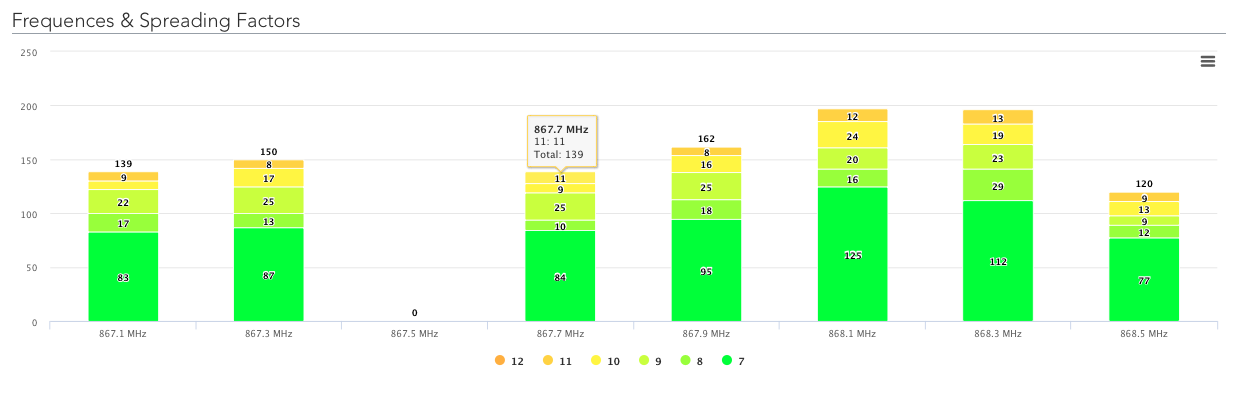
The next tab shows graphs of Frequencies and Spreading Factors (percentage and count) per selected period of time.
.png)