These charts represent LoRaWAN device signal and gateway communication metrics.
Data Rate and Spreading Factor Over Time
.png)
Data Rate: Fixed at level 5 across the week.
Spreading Factor: Constant at SF7 (faster but shorter range).
Use: Confirms stable network conditions and device configuration (e.g., no ADR changes).
These visualizations are commonly used to monitor signal health, gateway usage, and transmission consistency in LoRaWAN deployments. The use can also use Zoom to focus on specific date of the area that user zoom.
Frequency vs Time
.png)
Y-Axis: Frequency of transmitted packets (867–869 MHz).
X-Axis: Timestamp across several days (June 18–25).
Purpose: Visualizes the frequency hopping behavior of LoRaWAN transmissions over time.
RSSI/SNR Summary
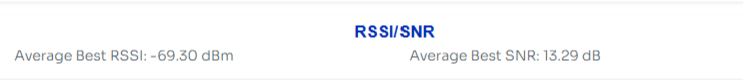
RSSI: Average Best RSSI = –69.30 dBm (signal strength received by gateway).
SNR: Average Best SNR = 13.29 dB (signal clarity vs noise).
Gateway Communication
.png)
Each row represents a unique gateway (by MAC address).
Colored bars indicate successful receptions over time.
Thicker clusters show higher traffic received by that gateway.
Users can focus on specific gateways by selecting only the ones they want to highlight. By deselecting other gateways, the interface will filter the view to display only the selected gateway(s).