![]() Click the Downlink tab to see the downlink data sent to the sensor. The service provider role can choose to initialize a downlink message to the sensor from here.
Click the Downlink tab to see the downlink data sent to the sensor. The service provider role can choose to initialize a downlink message to the sensor from here.
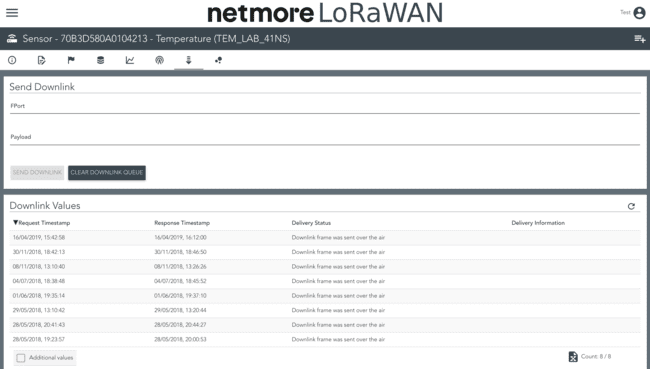
For each downlink message sent to the sensor, the following can be seen:
- Timestamp when the downlink message request was received to the portal
- Time when the response came back from the network server that message was sent to the sensor
- Delivery status of the message
The number of rows displayed in the list is dynamic depending on screen resolution. In the bottom right, below the list, you can see the number of lines of downlink messages currently displayed and the total number of lines available with downlink messages for the selected sensor.
If search results don't fit on a page, you'll see multiple clickable pages of search results.
You can sort columns by clicking the column heading. When a column is sorted, a small arrow shows ascending or descending sorting.
In the bottom right is an Excel icon that exports the list to Excel.
At the bottom left below the list is the checkbox for Additional values. Additional values show Fport and Payload for the downlink message.